| Strain Name |
C57BL/6-Cd3etm1(CD3E)Bcgen Cd3dtm1(CD3D)Bcgen Cd3gtm1(CD3G)Bcgen/Bcgen
|
Common Name | B-hCD3EDG mice |
| Background | C57BL/6 | Catalog number |
110039 |
|
Related Genes |
CD3E(CD3e molecule); CD3D(CD3d molecule); CD3G(CD3g molecule) | ||
|
NCBI Gene ID |
12501,12500,12502 | ||
mRNA expression analysis
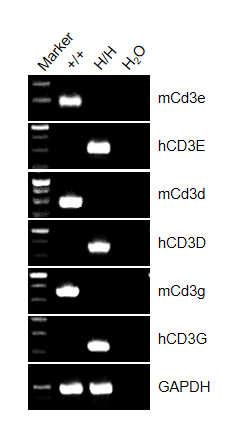
Strain specific analysis of CD3EDG gene expression in WT and homozygous B-hCD3EDG mice by RT-PCR.
Mouse Cd3e, Cd3d and Cd3g mRNA was detectable only in thymocytes of wild type (+/+). Chimeric CD3E, CD3D and CD3G mRNA was detectable only in H/H, but not in +/+ mice.
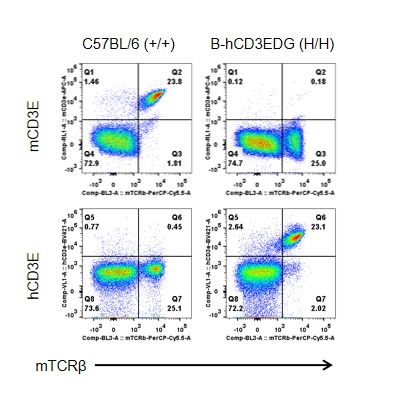
Strain specific CD3E expression analysis in homozygous B-hCD3EDG mice by flow cytometry.
Splenocytes were collected from wild type (WT) mice (+/+) and homozygous B-hCD3EDG mice (H/H), and analyzed by flow cytometry with species-specific anti-CD3ε antibody. Mouse CD3E was detectable in WT mice (+/+). Human CD3E was exclusively detectable in homozygous B-hCD3EDG mice (H/H) but not in WT mice (+/+).
Weight of spleen and the total cell number of splenocytes in homozygous B-hCD3EDG mice
(A) Size of spleen from C57BL/6 and B-hCD3EDG mice (n=3, 7 week-old). (B) The weight of spleen in C57BL/6 and B-hCD3EDG mice was similar. (C) The number of splenocytes in C57BL/6 and B-hCD3EDG mice was similar.
(A) Size of thymus from C57BL/6 and B-hCD3EDG mice (n=3, 7 week-old). (B) The weight of thymus in C57BL/6 and B-hCD3EDG mice was similar, but the weight of thymus in B-hCD3EDG mice was lower than that in C57BL/6 mice.(C) The number of thymocytes in C57BL/6 and B-hCD3EDG mice was similar, but the number of thymocytes in B-hCD3EDG mice was lower than that in C57BL/6.


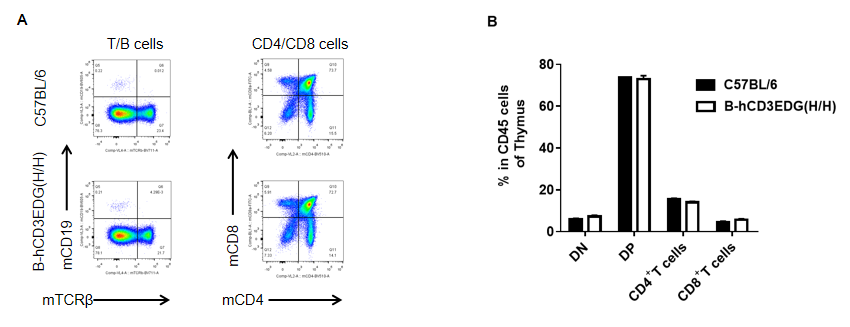
Analysis of thymus leukocyte subpopulations by FACS. Thymocytes were isolated from female C57BL/6 and B-hCD3EDG mice (n=3, 7 week-old) . Flow cytometry analysis of the thymocytes was performed to assess leukocyte subpopulations. A. Representative FACS plots. Single live cells were gated for CD45 population and used for further analysis as indicated here. B. Results of FACS analysis. Percent of CD4/CD8 cells, B cells in homozygous B-hCD3EDG mice were similar to those in the C57BL/6 mice, demonstrating that introduction of hCD3EDG in place of its mouse counterpart does not change the overall development, differentiation or distribution of these cell types in thymus.
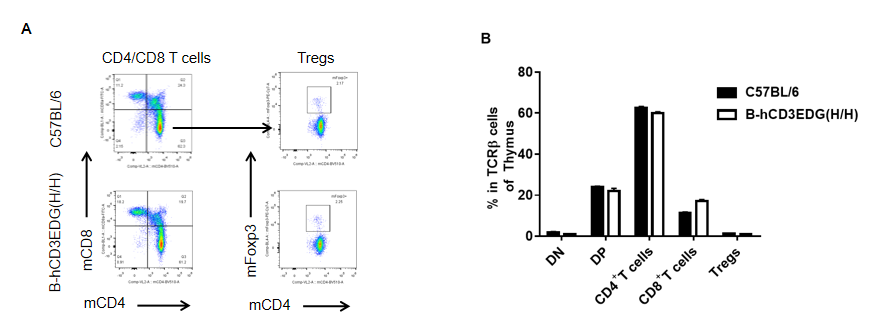
Analysis of thymus T cell subpopulations by FACS. Thymocytes were isolated from female C57BL/6 and B-hCD3EDG mice (n=3, 7 week-old). Flow cytometry analysis of the thymocytes was performed to assess leukocyte subpopulations. A. Representative FACS plots. Single live CD45+ cells were gated for CD3 T cell population and used for further analysis as indicated here. B. Results of FACS analysis. Percent of CD8, CD4, and Treg cells in homozygous B-hCD3EDG mice were similar to those in the C57BL/6 mice, demonstrating that introduction of hCD3EDG in place of its mouse counterpart does not change the overall development, differentiation or distribution of these T cell subtypes in thymus. Values are expressed as mean ± SEM.
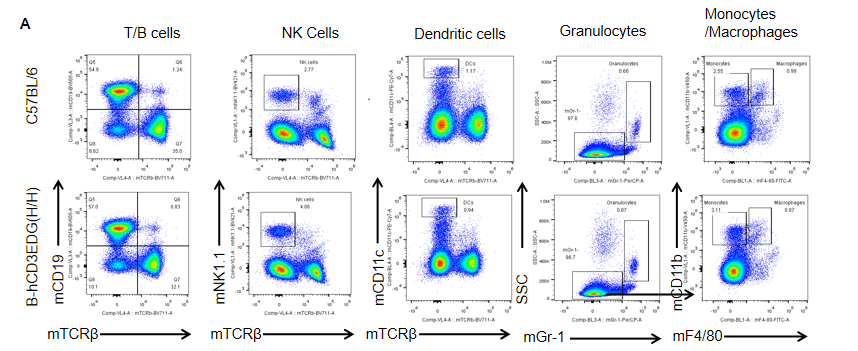
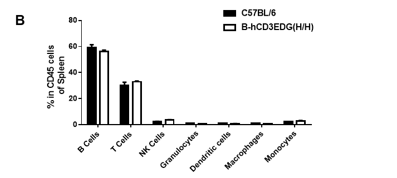
Analysis of spleen leukocyte subpopulations by FACS. Splenocytes were isolated from female C57BL/6 and B-hCD3EDG mice (n=3, 7 week-old). Flow cytometry analysis of the splenocytes was performed to assess leukocyte subpopulations. A. Representative FACS plots. Single live cells were gated for CD45 population and used for further analysis as indicated here. B. Results of FACS analysis. Percent of T, B, NK, DC, Granulocyte, Monocyte, and macrophage cells in homozygous B-hCD3EDG mice were similar to those in the C57BL/6 mice, demonstrating that introduction of hCD3EDG in place of its mouse counterpart does not change the overall development, differentiation or distribution of these cell types in spleen.
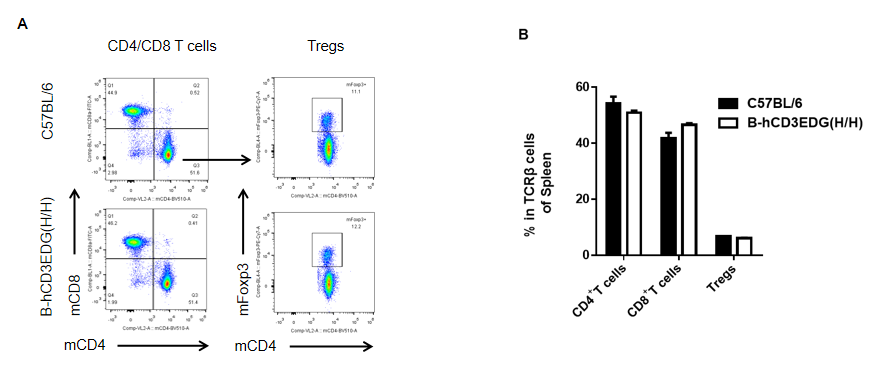
Analysis of spleen T cell subpopulations by FACS. Splenocytes were isolated from female C57BL/6 and B-hCD3EDG mice (n=3, 7 week-old). Flow cytometry analysis of the splenocytes was performed to assess leukocyte subpopulations. A. Representative FACS plots. Single live CD45+ cells were gated for CD3 T cell population and used for further analysis as indicated here. B. Results of FACS analysis. Percent of CD8, CD4, and Treg cells in homozygous B-hCD3EDG mice were similar to those in the C57BL/6 mice, demonstrating that introduction of hCD3EDG in place of its mouse counterpart does not change the overall development, differentiation or distribution of these T cell subtypes in spleen. Values are expressed as mean ± SEM.
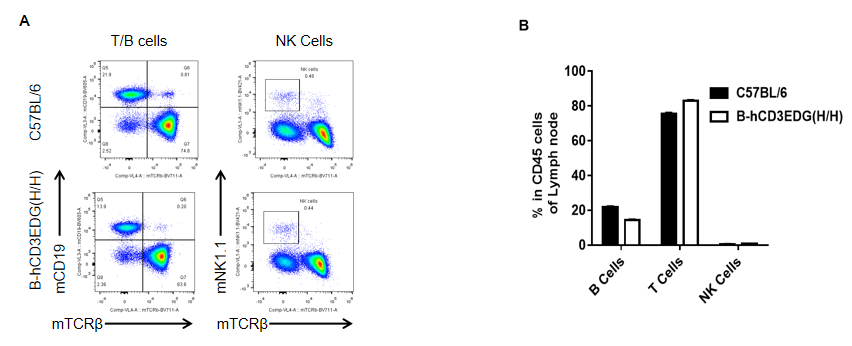
Analysis of spleen leukocyte subpopulations by FACS. Lymph nodes were isolated from female C57BL/6 and B-hCD3EDG mice (n=3, 7 week-old). Flow cytometry analysis was performed to assess leukocyte subpopulations. A. Representative FACS plots. Single live cells were gated for CD45 population and used for further analysis as indicated here. B. Results of FACS analysis. Percent of T, B, NK in homozygous B-hCD3EDG mice were similar to those in the C57BL/6 mice, demonstrating that introduction of hCD3EDG in place of its mouse counterpart does not change the overall development, differentiation or distribution of these cell types in lymph nodes.
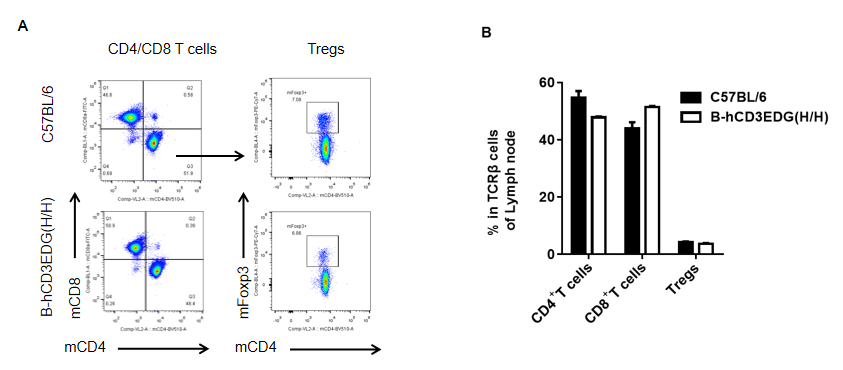
Analysis of spleen T cell subpopulations by FACS. Lymph node were isolated from female C57BL/6 and B-hCD3EDG mice (n=3, 7 week-old). Flow cytometry analysis of the splenocytes was performed to assess leukocyte subpopulations. A. Representative FACS plots. Single live CD45+ cells were gated for CD3 T cell population and used for further analysis as indicated here. B. Results of FACS analysis. Percent of CD8, CD4, and Treg cells in homozygous B-hCD3EDG mice were similar to those in the C57BL/6 mice, demonstrating that introduction of hCD3EDG in place of its mouse counterpart does not change the overall development, differentiation or distribution of these T cell subtypes in lymph node . Values are expressed as mean ± SEM.
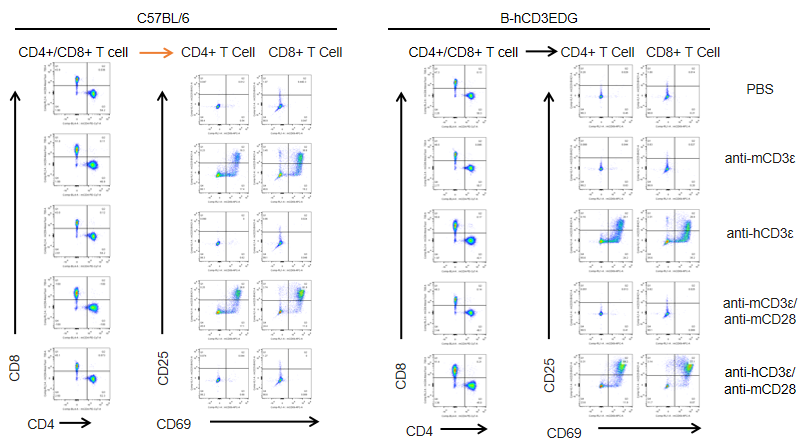
T cells (2×10⁵) were isolated from splenocytes of C57BL/6 and B-hCD3EDG mice (n=3,16 week-old), and were incubated in the presence of anti-CD3ε antibody (2ug/ml) and anti-mCD28 antibody (5ug/ml) for 24h. T cell proliferation was tested by flow cytometry. T cell activation in B-hCD3EDG mice was significantly up-regulated by Anti-CD3ε antibody, similar to the activation level shown in C57BL/6 mice treated with anti-mCD3ε antibody.
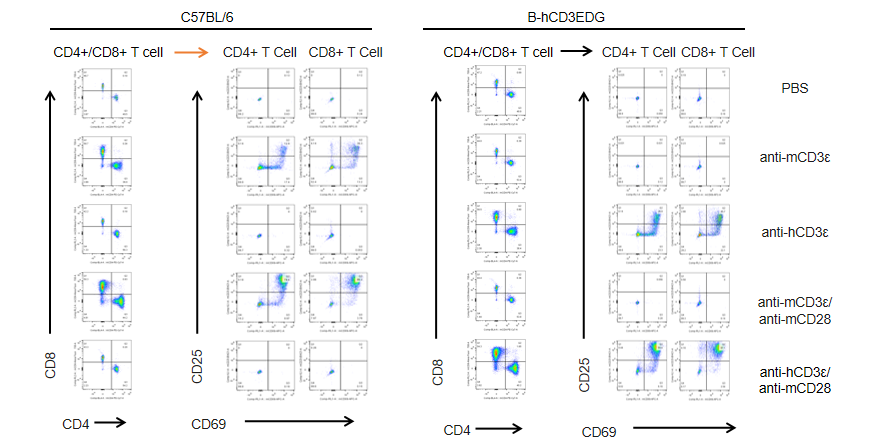
T cells (2×10⁵) were isolated from splenocytes of C57BL/6 and B-hCD3EDG mice (n=3,16 week-old), and were incubated in the presence of anti-CD3ε antibody (2ug/ml) and anti-mCD28 antibody (5ug/ml) for 48h. T cell proliferation was tested by flow cytometry. T cell activation in B-hCD3EDG mice was significantly up-regulated by anti-hCD3ε antibody, similar to the activation level shown in C57BL/6 mice treated with anti-mCD3ε antibody.
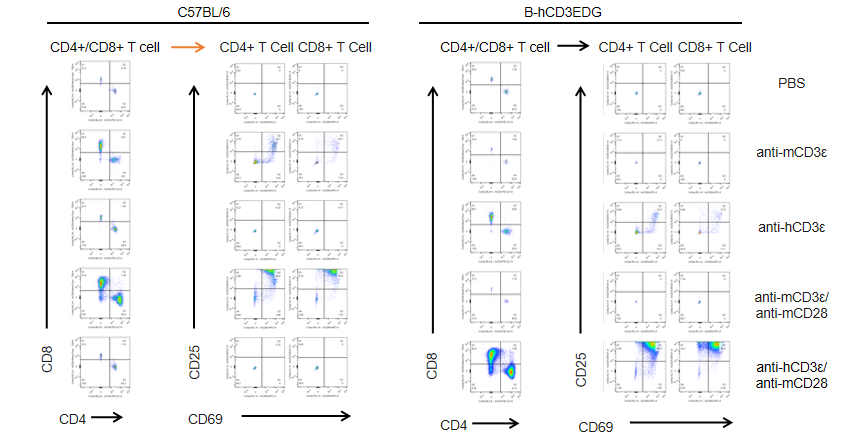
T cells (2×10⁵) were isolated from splenocytes of C57BL/6 and B-hCD3EDG mice (n=3,16 week-old), and were incubated in the presence of anti-CD3ε antibody (2ug/ml) and anti-mCD28 antibody (5ug/ml) for 72h. T cell proliferation was tested by flow cytometry. T cell activation in B-hCD3EDG mice was significantly up-regulated by anti-hCD3ε antibody, similar to the activation level shown in C57BL/6 mice treated with anti-mCD3ε antibody.
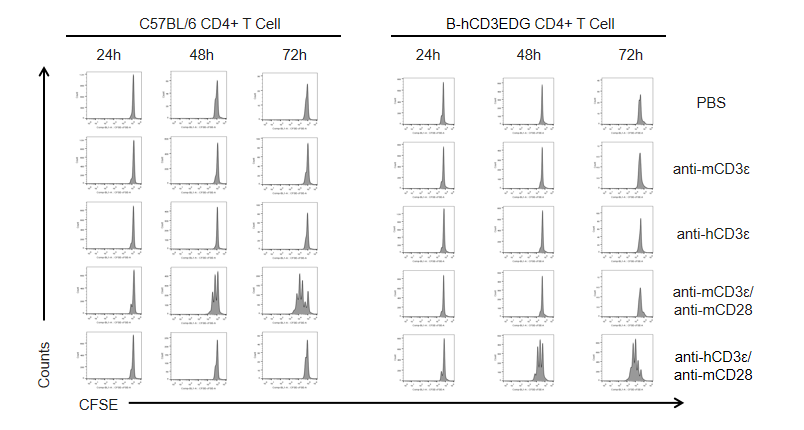
T cells (2×10⁵) were isolated from the splenocytes of C57BL/6 and B-hCD3EDG mice (n=3, 16 week-old), and incubated in the presence of anti-CD3ε antibody (2ug/ml) and anti-mCD28 antibody (5ug/ml) for 24h, 48h and 72h. T cell proliferations were measured by flow cytometry. As a result, the T cell activation in B-hCD3EDG mice was specifically up-regulated by anti-hCD3ε antibody, similar to the level of activation in the anti-mCD3ε antibody-treated C57BL/6 mice.
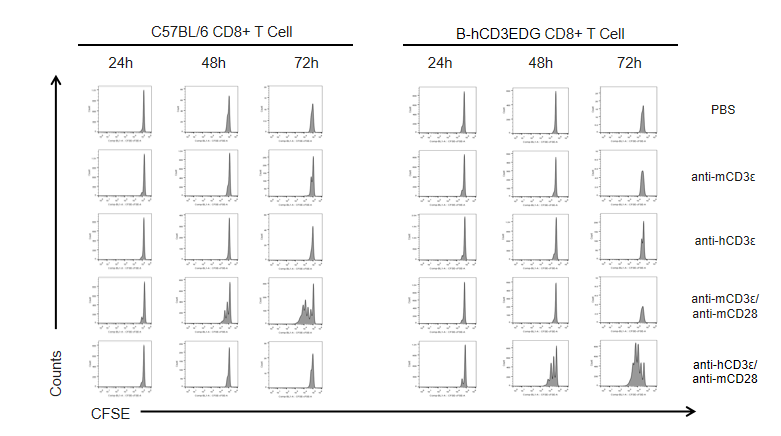
T cells (2×10⁵) were isolated from the splenocytes of C57BL/6 and B-hCD3EDG mice (n=3, 16 week-old), and incubated in the presence of anti-CD3ε antibody (2ug/ml) and anti-mCD28 antibody (5ug/ml) for 24h, 48h and 72h. T cell proliferations were measured by flow cytometry. As a result, the T cell activation in B-hCD3EDG mice was specifically up-regulated by anti-hCD3ε antibody, similar to the level of activation in the anti-mCD3ε antibody-treated C57BL/6 mice.
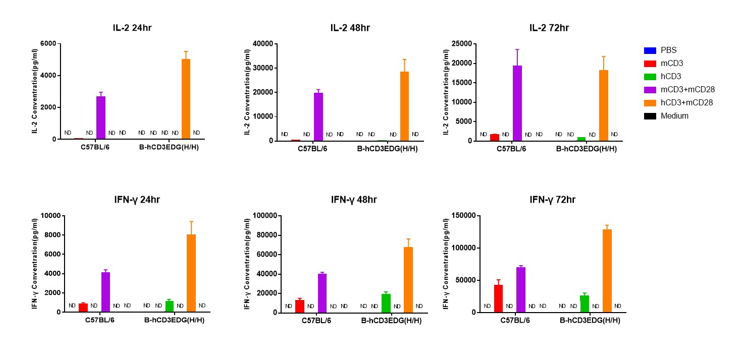
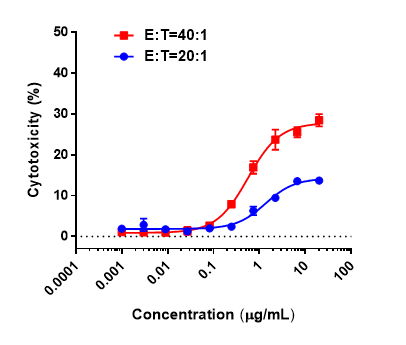

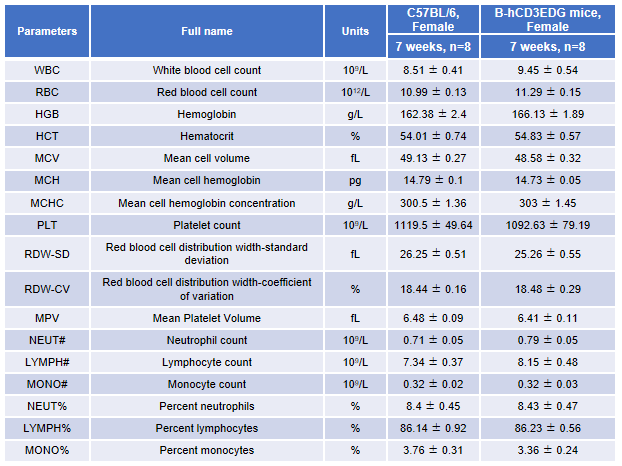
Complete blood count (CBC). Blood from female C57BL/6 and B-hCD3EDG mice (n=8, 7-week-old) were collected and analyzed for CBC. There was no differences among any measurement between C57BL/6 and B-hCD3EDG mice, indicating that introduction of hCD3EDG in place of its mouse counterpart does not change blood cell composition and morphology. Values are expressed as mean ± SEM.
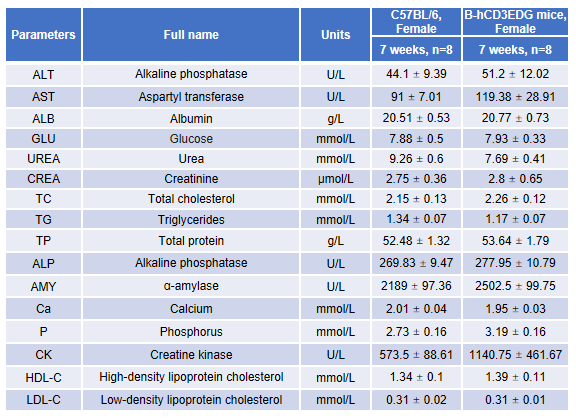
Blood chemistry tests of B-hCD3EDG mice. Serum from female C57BL/6 and B-hCD3EDG mice (n=8, 7-week-old) were collected and analyzed for levels of ALT (alanine aminotransferase) and AST (aspartate aminotransferase). There was no differences among any measurement between C57BL/6 and B-hCD3EDG mice, indicating that introduction of hCD3EDG in place of its mouse counterpart does not change ALT and AST levels or health of liver. Values are expressed as mean ± SEM.
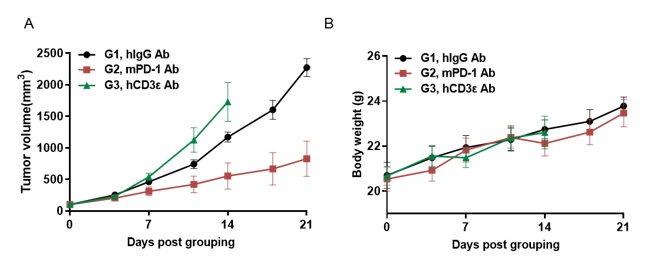
Antitumor activity of anti-hCD3ε antibody and anti-mPD-1 antibody in B-hCD3EDG mice. Murine colon cancer MC38 cells were subcutaneously implanted into B-hCD3EDG mice (female, 8 week-old, n=5). Mice were grouped when the tumor size was approximately 100±50mm3 , at which time they were treated with different antibodies with doses and schedules indicated in panel. (A) Tumor volume changes during treatment. (B) Body weight changes during treatment. As shown in panel A, anti-mPD-1 antibody significantly inhibited tumor growth in B-hCD3EDG mice, indicating their T cells function normally. However, in B-hCD3EDG mice, tumor growth was faster after anti-hCD3ε antibody treatment, which may be caused by activation induced cell death (AICD). As a result, the B-hCD3EDG mouse model is a powerful tool for in vivo CD3 antibody pharmacological efficacy studies. Values are expressed as mean ± SEM.
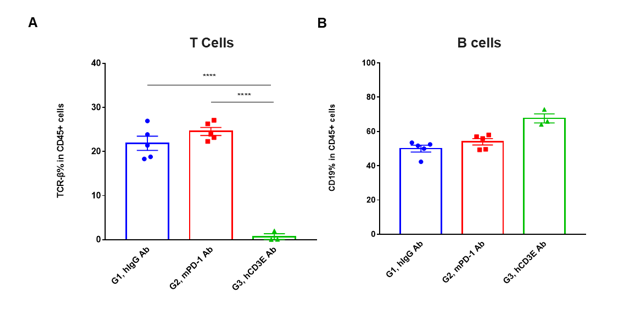
T cells and B cells activation in vivo efficacy . Lymphocytes were isolated from peripheral blood at 48 hours after treatment. In the anti-hCD3ε antibody treatment group, the proportion of T cells was significantly decreased due to the activation induced cell death (AICD) effect caused by anti-hCD3ε antibody treatment. (A) The percentage of TCR-β + cells in total CD45+ cells after treatment. (B) The percentage of CD19+ cells in total CD45+ cells after treatment.
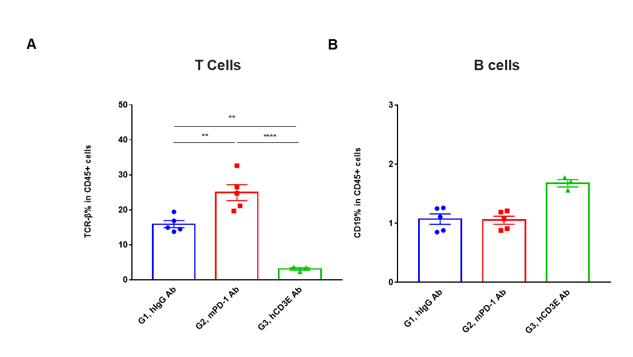
T cells and B cells activation in vivo efficacy . Lymphocytes were isolated from tumor at 48 hours after treatment. In the anti-hCD3ε antibody treatment group, the proportion of T cells was significantly decreased due to the activation induced cell death (AICD) effect caused by anti-hCD3ε antibody treatment. (A) The percentage of TCR-β + cells in total CD45+ cells after treatment. (B) The percentage of CD19+ cells in total CD45+ cells after treatment.

Antitumor activity of antibody X in B-hCD3EDG mice. B-hBCMA MC38 cells were subcutaneously implanted into B-hCD3EDG mice (female, 6 week-old, n=5). Mice were grouped when the tumor size was approximately 100mm3, at which time they were treated with antibody X provided by the client with doses and schedules indicated in panel A. (A) Tumor volume changes during treatment. (B) Body weight changes during treatment. As shown in panel A, antibodies X with different doses were efficacious in controlling tumor growth in B-hCD3EDG mice, demonstrating that the B-hCD3EDG mouse model is a powerful tool for in vivo efficacy study of T cell bispecific antibody. Values are expressed as mean ± SEM.

6- to 8-week-old female B-hCD3EDG mice, which are genetically modified to express human CD3E, CD3D, and CD3G, were purchased from Biocytogen Pharmaceuticals Co., Ltd (Beijing, China) and subcutaneously inoculated with MC38/BCMA cells. Tumor-bearing mice were randomized into groups and intravenously (i.v.) injected with vehicle or GR1803 when the average tumor volume reached approximately 50–100 mm3. Tumor volume was calculated as (length×width2)/2, and body weight was monitored as an indicator of general health. As shown in Fig 6A, GR1803 significantly inhibited the growth of MC38/BCMA tumors when mice were given a single intravenous injection of GR1803 at a dose of 0.1 or 0.3 mg/kg. The tumor-bearing mice tolerated these doses well, as evidenced by the absence of significant body weight loss during the course of the experiment in all groups. Consistent with this, GR1803 significantly down-regulated BCMA expression in tumor tissues, beginning at 4 h after injection and continuing for at least 10 days post-injection (Fig. 6B). The data comes from the client's literature.


 京公網安備: 11011502005564號