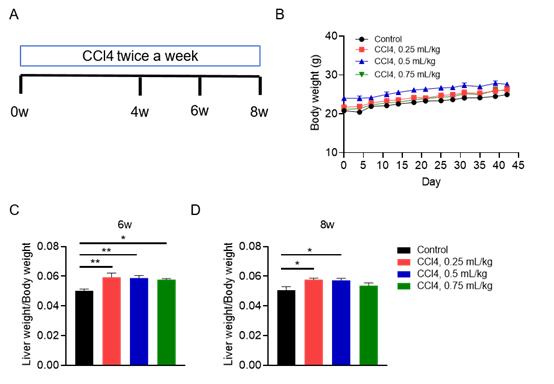
四氯化碳(CCl4)誘導的小鼠肝纖維化和肝硬化是被廣泛接受的研究肝纖維化和肝硬化的實驗模型。它在許多方麵反映了與毒性損傷相關的人類疾病模式,如α-SMA表達、星狀細胞活化和關鍵基質成分(包括膠原蛋白-1、基質金屬蛋白酶及其抑製劑TIMPs)已在該模型的發病機製中得到證實。CCl4誘導在肝髒中引起可重現的和可預測的纖維化反應,使其成為抗纖維化和抗肝硬化治療的臨床前藥理學研究和肝纖維化-肝硬化-肝癌變化的病理生理學研究的寶貴基礎。


四氯化碳(CCl4)誘導的NASH模型。8周齡的雄性C57BL/6小鼠腹腔注射CCl4,濃度分別為:0.25、0.5和0.75 mL/kg,每周2次。分別誘導4周、6周和8周後進行血生化及組織學染色分析。(A)CCl4誘導NASH模型方案示意圖;(B)小鼠體重;(C-D)分別誘導6周和8周的肝髒重量與體重的比值。結果顯示:CCl4誘導組與對照組相比,肝髒重量明顯增加。數據為平均值±SEM,n = 5。


四氯化碳(CCl4)誘導的NASH模型小鼠肝組織切片染色結果。(A)不同濃度(0.25 mL/kg、0.5 mL/kg、0.75 mL/kg)CCl4分別誘導4周、6周和8周後,對肝組織切片進行HE染色;(B)肝巨噬細胞(枯否細胞)的標誌物F4/80的免疫組化檢測。結果顯示:CCl4誘導組與對照組相比,肝組織切片HE染色顯示廣泛的肝細胞脂肪變性、氣球樣變和小葉內炎症;肝巨噬細胞數量顯著增加。以上都是NASH的典型病理變化。數據為平均值±SEM,n = 5。


四氯化碳(CCl4)誘導的NASH模型小鼠肝纖維化檢測結果。不同濃度(0.25 mL/kg、0.5 mL/kg、0.75 mL/kg)CCl4分別誘導4周、6周和8周後,製作肝組織切片。(A-B)肝組織切片天狼星紅染色及肝纖維化程度統計;(C-D)肝成纖維細胞的標誌物α-SMA的免疫組化檢測。結果顯示:CCl4誘導組與對照組相比,肝組織天狼星紅染色顯示明顯的肝纖維化;肝成纖維細胞明顯增多。以上結果說明CCl4誘導能成功建立NASH小鼠模型。數據為平均值±SEM,n = 5。
參考文獻
1. Scholten, D., Trebicka, J., Liedtke, C. & Weiskirchen, R. The carbon tetrachloride model in mice. Lab Anim 49, 4-11 (2015).
2. Hernandez-Perez, E., Leon Garcia, P.E., Lopez-Diazguerrero, N.E., Rivera-Cabrera, F. & Del Angel Benitez, E. Liver steatosis and nonalcoholic steatohepatitis: from pathogenesis to therapy. Medwave 16, e6535 (2016).
3. Tsuchida, T., et al. A simple diet- and chemical-induced murine NASH model with rapid progression of steatohepatitis, fibrosis and liver cancer. J Hepatol 69, 385-395 (2018).
4. Farrell, G., et al. Mouse Models of Nonalcoholic Steatohepatitis: Toward Optimization of Their Relevance to Human Nonalcoholic Steatohepatitis. Hepatology 69, 2241-2257 (2019).
Establishment of Bile duct ligation induced liver fibrosis model


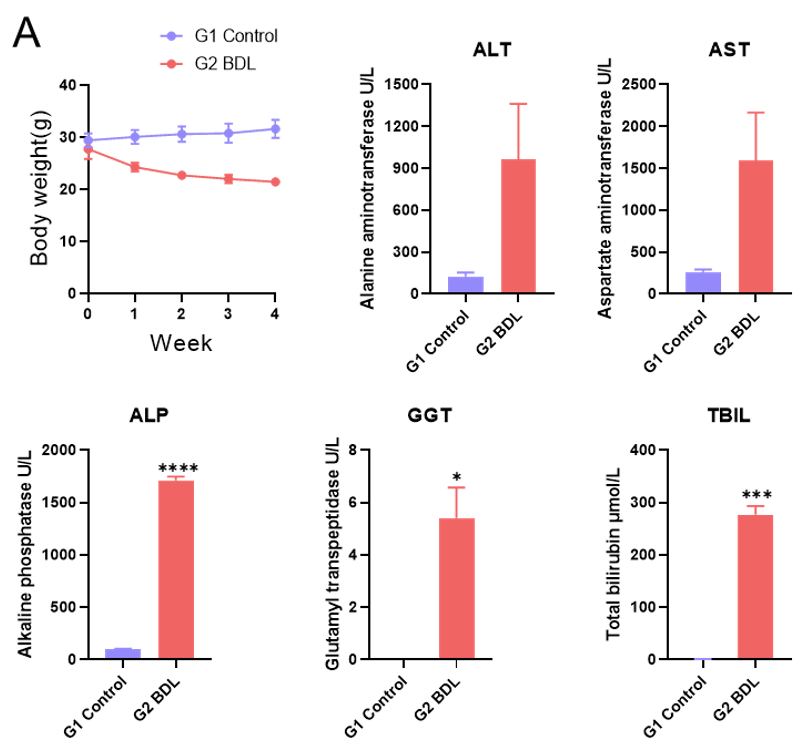
Liver fibrosis model by bile duct ligation (A) ALT, AST, ALP, GGT and TBIL levels in serum.(B)Representative appearance of livers 4 weeks after BDL. Values are expressed as mean ± SEM. *p<0.05, ***p<0.001, ****p<0.0001.
Histologic Assessment of Bile duct ligation induced liver fibrosis model

H&E and Sirius red staining after Bile duct ligation 4 weeks (A) Representative pictures of H&E staining. (B) Representative pictures of sirius red staining showing increased liver fibrosis. (C) Positive signal area of collagen fiber. Values are expressed as mean ± SEM. *p<0.05.
Establishment of TAA-induced liver fibrosis model


TAA induced liver fibrosis model for 4/6 weeks. (A-B) ALT and AST levels in serum. (C) Representative pictures of H&E staining. (D-E) Representative images of immunohistochemical staining showing α-SMA and positive area(G-F) Representative pictures of sirius red staining showing increased liver fibrosis and positive area. Values are expressed as mean ± SEM. *p<0.05, **p<0.01, ***p<0.001, ****p<0.0001.


 京公網安備: 11011502005564號


